
Average Penis Girth
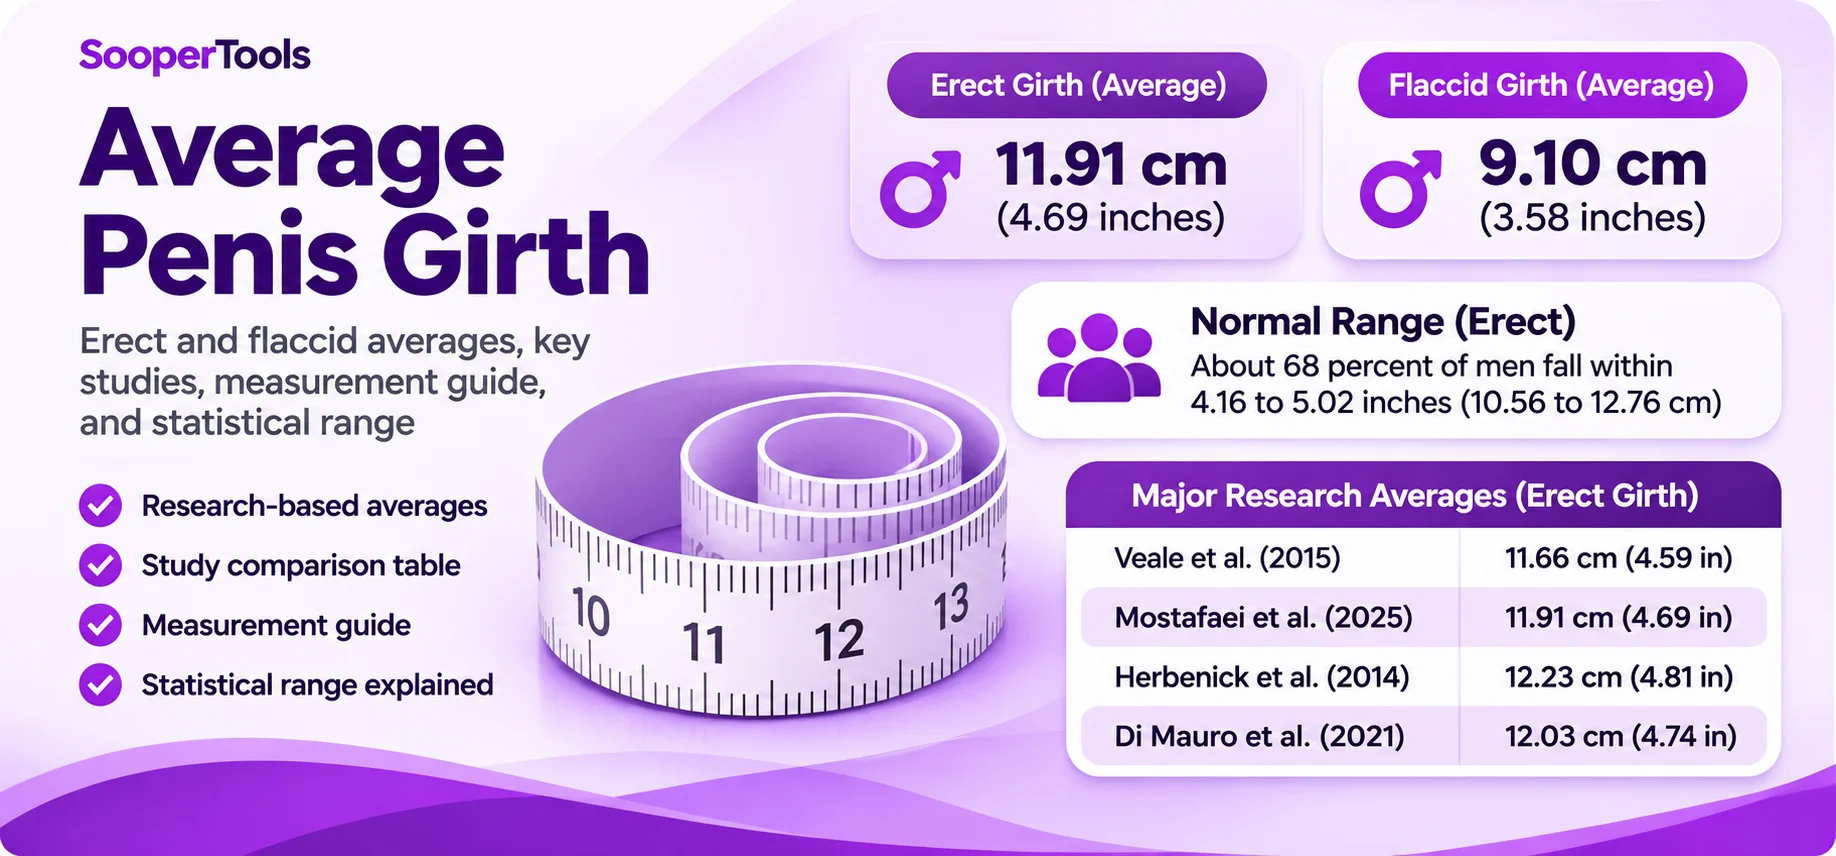
Table of Contents
Average Penis Girth: Erect and Flaccid Averages
The average penis girth is approximately 11.91 cm (4.69 inches) when erect and 9.10 cm (3.58 inches) when flaccid, according to a 2025 systematic review and meta analysis of clinical measurements. Earlier research reported slightly different averages, including 11.66 cm (4.59 inches) for erect circumference and 9.31 cm (3.67 inches) for flaccid circumference. These differences highlight why research methods, measurement locations, and participant samples matter when comparing published figures.
This guide examines major scientific studies, explains how average girth is calculated, and compares the evidence behind commonly reported measurements. It also explains statistical ranges, the difference between circumference and diameter, and why different health websites sometimes publish different numbers.
What Is the Average Girth of a Penis?
Average girth refers to the average circumference measured around the penile shaft. It describes the distance around the shaft rather than its width or diameter.
Recent clinical research provides the following reference figures:
| Measurement | Average circumference | Equivalent in inches |
|---|---|---|
| Erect penis girth | 11.91 cm | 4.69 inches |
| Flaccid penis girth | 9.10 cm | 3.58 inches |
These values come from a 2025 systematic review involving 33 studies and 36,883 participants. However, the sample size differed according to the measurement being analyzed.
The erect circumference average was calculated from 5,168 measurements, while the flaccid circumference average was based on 30,117 measurements.
These are population research averages, not medical requirements or measurements that every individual should have.
Average Penis Girth When Erect
The average erect penis girth is approximately 11.91 cm (4.69 inches) in the 2025 pooled research.
An earlier systematic review published in 2015 by Veale and colleagues reported an average erect circumference of 11.66 cm (4.59 inches).
Although the difference is relatively small, the two results come from separate collections of studies and different sample sizes.
| Research study | Average erect circumference | Sample size |
|---|---|---|
| Veale et al. (2015) | 11.66 cm (4.59 in) | 381 |
| Mostafaei et al. (2025) | 11.91 cm (4.69 in) | 5,168 |
| Herbenick et al. (2014), United States | 12.23 cm (4.81 in) | 1,661 |
| Di Mauro et al. (2021), Italy | 12.03 cm (4.74 in) | 4,685 |
The first two results come from research reviews of clinician measured studies. The American and Italian studies used participant measurements after instructions were provided. They should therefore be interpreted separately rather than treated as identical research methods.
For a general population reference, the 2025 pooled result provides a useful recent benchmark.
Average Flaccid Penis Girth
The average flaccid penis girth is approximately 9.10 cm (3.58 inches) according to the 2025 meta analysis.
The 2015 systematic review reported a slightly higher average of 9.31 cm (3.67 inches).
| Research study | Average flaccid circumference | Sample size |
|---|---|---|
| Veale et al. (2015) | 9.31 cm (3.67 in) | 9,407 |
| Mostafaei et al. (2025) | 9.10 cm (3.58 in) | 30,117 |
| Di Mauro et al. (2021), Italy | 9.59 cm (3.78 in) | 4,685 |
Flaccid measurements can vary with environmental temperature, physical conditions, and the circumstances in which measurements are taken.
A flaccid measurement should not be assumed to represent erect circumference. Both measurements describe different physical states and should be compared separately.
Scientific Studies on Average Penis Girth
Understanding the average girth of penis measurements requires examining the original research rather than relying only on summary articles or online comparison charts.
Several studies provide useful reference information.
1. Veale et al. (2015): The Clinical Measurement Review
A systematic review published in BJU International by David Veale and colleagues examined penile measurements from up to 15,521 men.
The researchers included studies in which healthcare professionals measured participants using standard procedures. Studies also needed a minimum of 50 participants per sample.
The review reported:
| Measurement | Average | Standard deviation | Sample |
|---|---|---|---|
| Flaccid circumference | 9.31 cm | 0.90 cm | 9,407 |
| Erect circumference | 11.66 cm | 1.10 cm | 381 |
An important detail is that 15,521 represents the total number of men across different measurement categories. It does not mean that all participants contributed erect circumference measurements.
Only 381 men contributed to the erect circumference analysis.
The researchers also used statistical modeling to construct reference charts, known as nomograms, for different penile measurements.
This research remains an important clinical reference because it provides separate measurement averages and statistical distributions.
Read the original research: Veale et al. (2015), BJU International.
2. Mostafaei et al. (2025): A Larger International Meta Analysis
A more recent systematic review by Hadi Mostafaei and colleagues examined 33 studies involving 36,883 participants.
The researchers analyzed different penile measurements and grouped findings by World Health Organization geographic regions.
For circumference, the results were:
| Measurement | Mean circumference | Sample size | Standard error |
|---|---|---|---|
| Flaccid | 9.10 cm | 30,117 | 0.12 cm |
| Erect | 11.91 cm | 5,168 | 0.18 cm |
The review provides a larger pooled reference for both flaccid and erect circumference than the earlier 2015 review.
However, the standard error should not be confused with the standard deviation of individual measurements. It describes uncertainty around the estimated average, not the typical amount by which individuals vary.
The researchers reported moderate to low risk of bias across their included studies, although differences in research methodology remained important limitations.
Read the original research: Mostafaei et al. (2025), Systematic Review and Meta Analysis.
3. Herbenick et al. (2014): Research Involving Men in the United States
A study published in the Journal of Sexual Medicine examined 1,661 sexually active men in the United States.
It reported an average erect circumference of 12.23 cm (4.81 inches), with a standard deviation of 2.23 cm.
Participants measured themselves during an internet based research project involving condoms sized to fit their erect measurements.
This study provides useful information about a U.S. participant sample, but it is different from a clinical review where healthcare professionals perform measurements.
The sample should not automatically be treated as representative of every man in the United States.
Read the original research: Herbenick et al. (2014), Journal of Sexual Medicine.
4. Di Mauro et al. (2021): A Large Study of Italian Men
A study published in Andrologia examined 4,685 men who visited urology outpatient units in Italy between January 2019 and January 2020.
Participants received instructions explaining how to measure their penile dimensions.
The reported averages included:
| Measurement | Average circumference |
|---|---|
| Flaccid | 9.59 cm (3.78 in) |
| Erect | 12.03 cm (4.74 in) |
The researchers reported substantial variation between participants.
Because the participants came from urology outpatient settings and performed their own measurements after receiving instructions, this result should not be interpreted as a definitive average for the entire Italian population.
Read the original research: Di Mauro et al. (2021), Andrologia.
Average Penis Girth and the Statistical Range
Knowing the average is useful, but it does not explain how measurements are distributed across a population.
A statistical distribution helps show how individual measurements vary around an average.
The Veale 2015 review reported an average erect circumference of 11.66 cm with a standard deviation of 1.10 cm.
Using one standard deviation below and above that average gives:
| Statistical measurement | Circumference |
|---|---|
| Average | 11.66 cm |
| One standard deviation below average | 10.56 cm |
| One standard deviation above average | 12.76 cm |
In inches, this interval is approximately 4.16 to 5.02 inches.
Under a normal distribution model, approximately 68% of observations fall within one standard deviation of the mean.
This is the statistical basis for the commonly reported erect girth range of approximately 4.2 to 5.0 inches.
However, it is important to understand that this is a model based interval derived from the 2015 study. It is not a direct count proving that exactly 68% of all men worldwide fall within those measurements.
The 2025 meta analysis reported standard errors for its pooled averages. Those values should not be used as individual standard deviations to construct another 68% range.
Mean, Median, and Standard Deviation Explained
These statistical terms describe different characteristics of research data.
| Term | Meaning |
|---|---|
| Mean | The arithmetic average of the measurements |
| Median | The middle measurement when all values are arranged in order |
| Standard deviation | How widely individual observations are distributed around the average |
| Standard error | The estimated uncertainty of a calculated sample mean |
| Percentile | The proportion of a reference population whose measurements fall below a particular value |
These terms are not interchangeable.
For example, a 50th percentile represents the median, while an average represents the mean. They can be close, but they are not automatically identical.
This distinction matters when evaluating published penis girth charts. A chart should explain how its percentile values were derived and which original study supports them.
Why Do Different Websites Report Different Average Penis Girth Figures?
Online health publishers sometimes report different numbers even when they are discussing the same general measurement.
There are several reasons.
1. Different scientific studies
Verywell Health reports the newer erect circumference reference of 11.91 cm from the 2025 meta analysis.
WebMD continues to report the older Veale 2015 average of 11.66 cm.
Both figures have scientific sources, but they come from different research collections.
Comparing the values without identifying the research source can make them appear contradictory when they are actually separate estimates.
2. Different sample sizes
A study involving thousands of flaccid circumference measurements is not equivalent to one involving only a few hundred erect measurements.
The sample size for each measurement must be reported separately.
A large total study population does not automatically mean that every measurement has the same statistical support.
3. Clinical versus participant measurements
Some studies involve direct measurements by healthcare professionals.
Other research uses participants who follow written or illustrated instructions and record their own dimensions.
Both types of research can provide useful information, but they should not be combined without explaining their methodological differences.
4. Different measurement locations
Circumference can be measured at several locations along the shaft.
These locations can produce different results, particularly when comparing the middle of the shaft with the base or the area near the head.
The measurement location should therefore be recorded whenever possible.
5. Different statistical methods
Some charts reproduce published research tables, while others calculate additional percentile values through statistical modeling.
For example, a published girth chart may list a 50th percentile that differs from the mean reported in its cited study.
That difference does not automatically establish that the chart is incorrect. However, the source and mathematical method should be explained so readers can understand how the value was obtained.
A chart that cites a scientific paper should make clear whether it reproduces the paper’s original values or calculates additional values from its data.
Where Should Penis Girth Be Measured?
Measurement location matters when interpreting scientific circumference data.
The 2026 European Association of Urology guidelines identify three relevant circumference locations.
| Location | Description |
|---|---|
| Proximal | Near the base, where the shaft meets the pubic area |
| Middle shaft | Around the middle portion of the shaft |
| Distal | Near the head, around the coronal or subcoronal area |
The EAU guidance recommends recording distal and mid shaft measurements during clinical assessment. Its measurement table also identifies proximal circumference as a relevant anatomical location.
This is important because the base and middle of the shaft should not automatically be assumed to have identical circumference.
The same research comparison should use clearly defined measurement locations rather than mixing measurements taken from different parts of the shaft.
Read the clinical guidance: European Association of Urology, 2026 Sexual and Reproductive Health Guidelines.
Girth, Circumference, and Diameter: Understanding the Difference
Girth and circumference generally describe the same measurement in this context.
They refer to the distance around the penile shaft.
Diameter describes the distance across a circular cross section. It is not the same as circumference.
| Term | Definition |
|---|---|
| Girth | Common term for the measurement around the shaft |
| Circumference | Technical term for the distance around the shaft |
| Diameter | Distance across a circular cross section |
For example, if a study reports an erect circumference of 11.91 cm, it is describing the distance around the shaft, not its width.
Keeping these terms separate prevents confusion when reading measurement charts and research papers.
Clinical Measurements Versus Self Measured Results
One of the most important considerations when reading average penis girth statistics is how the measurements were collected.
Clinical measurements are generally recorded by healthcare professionals following a defined procedure.
Participant measurements are recorded by the individuals themselves, sometimes after receiving specific instructions.
The U.S. Herbenick study and the Italian Di Mauro study illustrate the second approach.
Their results are useful, but the participants, study settings, and measurement procedures differ from the clinical research included in the Veale review.
This does not mean that every self measured result is inaccurate or that a fixed correction should be applied to all participant measurements.
It means that the method should be identified before comparing research findings.
What Do Average Penis Girth Measurements Mean for Individuals?
A population average provides context about a research group. It does not determine an individual’s health or establish a measurement that everyone should have.
There is natural anatomical variation among individuals.
A measurement above or below a population average does not automatically indicate a health problem.
Research averages should not be used to judge masculinity, fertility, sexual ability, or personal worth.
For practical measurement instructions, visit the How to Measure Penis Correctly guide.
For individual measurement comparisons, explore the Penis Size Calculator and the Penis Size Percentile Guide.
For a broader explanation of length, girth, and clinical research, read Scientific Studies on Average Penis Size.
Key Takeaways
- The 2025 meta analysis reported an average erect circumference of 11.91 cm (4.69 inches) and flaccid circumference of 9.10 cm (3.58 inches).
- The 2015 Veale review reported 11.66 cm erect and 9.31 cm flaccid.
- Measurement sample sizes differ between erect and flaccid research.
- The approximate 68% erect circumference interval of 4.16 to 5.02 inches comes from the 2015 mean and standard deviation under a normal distribution model.
- Base, middle shaft, and distal measurements are different anatomical locations and should not automatically be treated as interchangeable.
- Clinical and participant measured studies should be interpreted separately.
- A population average is a statistical reference, not a medical requirement for an individual.
The most meaningful way to understand average penis girth is to consider the reported average together with the original research, sample size, measurement state, and methodology.
References and Scientific Sources
- Veale et al. (2015), BJU International, Systematic Review and Nomograms
- Mostafaei et al. (2025), Systematic Review and Meta Analysis
- Herbenick et al. (2014), Erect Penile Dimensions of 1,661 Men in the United States
- Di Mauro et al. (2021), Penile Length and Circumference in Young Italian Men
- European Association of Urology, 2026 Sexual and Reproductive Health Guidelines
Frequently Asked Questions
1. What is the average penis girth when erect?
The 2025 meta analysis reported an average erect circumference of 11.91 cm (4.69 inches), based on 5,168 measurements. The 2015 Veale review reported 11.66 cm (4.59 inches), based on 381 measurements.
2. What is the average girth of a penis when flaccid?
The 2025 research reported an average flaccid circumference of 9.10 cm (3.58 inches). The 2015 review reported 9.31 cm (3.67 inches). Both are population research estimates.
3. What is considered the normal range for erect penis girth?
The 2015 Veale research reported an average of 11.66 cm and a standard deviation of 1.10 cm. Under its normal distribution model, approximately 68% of observations fall between 10.56 and 12.76 cm, or approximately 4.16 to 5.02 inches. This is a statistical interval, not a clinical definition of normality.
4. Is 12 cm considered close to average erect girth?
Yes. A circumference of 12 cm is close to the 2025 pooled average of 11.91 cm. However, an individual measurement should be interpreted in the context of the measurement location and method.
5. Is penis girth the same as circumference?
Yes. Girth is the commonly used term for the measurement around the shaft, while circumference is the more technical term. Diameter is a different measurement describing the distance across the shaft.
6. Does measuring at the base give the same result as measuring at mid shaft?
Not necessarily. The base and middle shaft are different anatomical locations, and their circumference may differ. The 2026 EAU clinical guidance identifies proximal, mid shaft, and distal measurement locations and recommends recording distal and mid shaft measurements during clinical assessment.
7. Why does UroSculpt show different girth percentile figures from other research sources?
Different charts may use different underlying data, statistical transformations, or reference tables. For example, the Veale 2015 review reports a mean flaccid circumference of 9.31 cm, while a separately published chart attributes a flaccid 50th percentile of 10.0 cm to that review. Readers should check how the chart derives its percentile values rather than assume that every displayed value is reproduced directly from the original study.
8. Are clinical measurements more reliable than self measured results?
Clinical measurements are generally more standardized because healthcare professionals follow defined procedures. Self measurement can also provide useful research data, but results may vary with measuring technique and study setting. The method should always be considered when comparing averages.
9. Which scientific study provides the most recent average girth reference?
The 2025 systematic review and meta analysis by Mostafaei and colleagues provides a recent pooled reference. It included 33 studies and 36,883 participants overall, with separate samples of 5,168 erect and 30,117 flaccid circumference measurements.
10. Can average penis girth determine whether an individual has a health problem?
No. A population average is not a medical diagnosis. Individual measurements vary, and circumference alone cannot determine sexual function or overall health. Consult a qualified healthcare professional when there is a personal medical concern.
Written by: SooperTools Editorial Team
Last updated: November 12, 2026